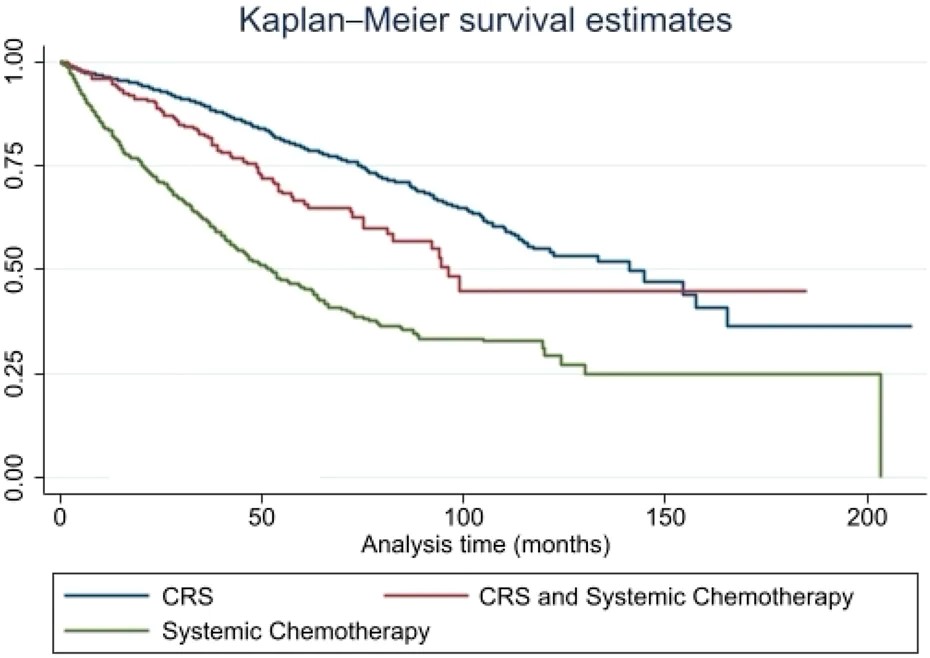
The definitive contribution of surgical cytoreduction in stage IV gastroenteropancreatic neuroendocrine neoplasms (GEP-NENs) remains unclear, as corroborating data come largely from retrospective reviews that infrequently compare surgery with current systemic regimens. Drawing on a nationwide oncology registry, we compared overall survival (OS) with cytoreductive surgery versus systemic therapy alone. Eligible adults had a diagnosis of stage IV, well-differentiated GEP-NEN documented in the National Cancer Database between 2004 and 2020. Patients were grouped by demographic, tumor, and institutional attributes. The three therapeutic strategies evaluated were cytoreductive surgery (CRS) as the sole modality, CRS in conjunction with systemic chemotherapy, and systemic chemotherapy without surgery. Overall survival (OS) was examined via Kaplan-Meier (KM) estimation and multivariable Cox proportional hazards regression. The analytic set included 3,183 individuals with stage IV GEP-NENs. Nearly 70% (69.8%) were managed with CRS alone, a small fraction (6.7%) received both CRS and systemic chemotherapy, and the remaining 23.4% underwent systemic therapy exclusively. Median overall survival (OS) diverged substantially across these strategies: patients receiving CRS alone reached a median of 140.9 months, those receiving both modalities had a median of 96.2 months, and those receiving systemic therapy alone had a median of 51.6 months (P < 0.001). The advantage conferred by CRS within each histologic grade category, evident in G1–G2 tumors (140.9 vs. 96.2 vs. 53.6 months; P < 0.001), was also observed in G3 well-differentiated tumors (39.8 vs. 13.1 vs. 9.6 months; P < 0.001). These benefits extended across the range of primary organ sites. For midgut primaries, median OS measured 157.6, 99.2, and 87.5 months, respectively (P < 0.001); for pancreatic primaries, the figures were 117.5 months, not reached, and 50.8 months (P < 0.001). In a multivariable framework, advancing age, lower socioeconomic standing, higher comorbidity indices, colorectal primary location, positive resection margins, and increasing tumor grade independently predicted worse survival. A surgery delay beyond 35 days from diagnosis was associated with more favorable survival outcomes. CRS emerged as an independent predictor of longer OS (HR = 0.80; 95% CI: 0.67-0.94). Receipt of systemic chemotherapy, by contrast, was independently tracked with elevated mortality risk (HR = 1.71, 95% CI: 1.36-2.17). Surgical cytoreduction in metastatic GEP-NENs corresponded to a clinically meaningful survival gain over management with systemic therapy alone. This observation was reproduced within every histologic grade and primary site examined. These results lend weight to the practice of offering CRS to carefully chosen patients and highlight the pressing requirement for prospective study designs to confirm these findings.
Introduction
Neuroendocrine neoplasms (NENs) encompass a biologically varied family of cancers that arise from dispersed endocrine cells, most abundantly within the gastrointestinal tract, which harbors over 60% of all cases [1, 2]. The recorded incidence has risen steeply in recent decades, reflecting advancements in imaging detection and pathologic recognition. Metastatic spread, predominantly to the liver, is already apparent in nearly half of all newly diagnosed individuals. Hepatic tumor burden constitutes a key driver of clinical deterioration and represents the leading proximate cause of disease-specific death.
The classification of NENs put forth by the World Health Organization (WHO) has undergone several meaningful revisions over the past decade. The 2010 schema distinguished well-differentiated NENs from poorly differentiated neuroendocrine carcinomas (NECs), yet grouped all neoplasms with a Ki-67 proliferation index exceeding 20% under the NEC umbrella [3]. More refined editions in 2017 and 2019 carved out a separate diagnostic slot: well-differentiated G3 NENs, defined by a well-differentiated cytoarchitectural appearance that persists despite brisk proliferative activity (Ki-67 > 20%). These tumors stand apart from poorly differentiated NEC both molecularly and clinically, now occupying a recognized position in the diagnostic continuum [4-7]. Addressing metastatic gastropancreatic-NENs (GEP-NENs) generally demands a multi-pronged treatment paradigm that coordinates systemic therapies, liver-directed interventions, and cytoreductive surgery (CRS). Authoritative international guidelines currently endorse systemic agents as the initial standard of care for distant disease, channeling chemotherapy preferentially toward higher-grade or rapidly progressive presentations [8]. Observational analyses and case series from academic centers suggest that cytoreduction of hepatic metastases may ameliorate hormone-related symptoms and prolong overall survival [9-15]. Nonetheless, these operations are not trivial and carry appreciable peri-procedural risks. Even as the desired completeness of resection remains unsettled, earlier work suggests that meaningful tumor volume reduction can translate into both symptomatic relief and a survival dividend [11, 12].
A persistent limitation of the extant literature is its reliance on historical reference populations rather than direct juxtaposition with contemporaneous systemic treatment in the metastatic GEP-NEN setting. Parsing the relative merits of operative versus pharmaceutical cytoreduction, therefore, remains an open question. To help resolve this ambiguity, we undertook a comparative assessment of the National Cancer Database (NCDB) to determine whether divergent overall survival patterns exist among patients who underwent CRS, systemic chemotherapy, or a combination of the two.
Materials and Methods
Data source and study population
The NCDB compiles oncology data from facilities nationwide, covering an estimated 70% or more of new cancer diagnoses across the United States. We screened the registry for adults aged 18 years or older diagnosed from 2004 to 2020 with a recorded stage IV GEP-NEN. Search parameters relied on ICD-10 topography codes corresponding to the pancreas (C250-4, C257-9), stomach (C160-6, C168-9), small intestine (C170-173, C178-9), appendix (C181), colon (C180, C182-9), rectum (C209), and intestines not elsewhere classified (C260). Verification of neuroendocrine histology utilized ICD-O-3 morphology codes 8150-3, 8150–8156, 8155-6, 8240, 8243-8246, 8013, 8574, and 8249 [16].
Tumor grade classification
Given shifting grade classification rubrics over the study’s time horizon, a synthesized variable was generated to maintain consistency. Patients diagnosed between 2004 and 2018 under ICD-O-3 grading were coded as G1 (well-differentiated) when designated grade I and G2 (moderately differentiated) when designated grade II. For those captured in 2018 and later, the WHO 5th edition criteria were applied to identify well-differentiated G3 tumors. Poorly differentiated NEC specimens, under any classification protocol, were systematically removed.
Exclusion criteria
Records were discarded if any of the following applied: absence of information on whether CRS or systemic chemotherapy was administered; incomplete or indeterminate data fields for primary tumor organ, metastatic site, or essential demographic characteristics; histologic features consistent with poorly differentiated NEC; or missing entries for overall survival time and follow-up status.
Treatment definitions
Operative cytoreduction was extracted from the procedural variable denoting surgical interventions at other sites, with codes 2, 4, and 5 signifying a non-primary procedure directed at other regional sites, other distant sites, or both concurrently. Systemic therapy was captured from the RX_SUMM_CHEMO field, where codes 1-3 indicate first-line chemotherapy administration. These definitions yielded three mutually exclusive treatment strata: CRS alone, CRS plus systemic chemotherapy, and systemic chemotherapy alone.
Covariates
We incorporated a wide-ranging collection of demographic, clinical, and institutional predictors. Demographic fields spanned age category, sex, racial and ethnic background, insurance type, and socioeconomic status (SES). A 7-tier composite index that merges indicators of education and income was utilized to approximate SES [17]. Ordered from lowest to highest, an index value of seven denotes the uppermost SES stratum. Clinical domains comprised the Charlson-Deyo comorbidity index (0, 1, ≥ 2), organ of tumor origin, histologic grade, documentation of lymphovascular invasion, resection margin outcome, distribution of metastases (limited to the liver vs. deposits beyond the liver), and the interval in days between diagnosis and the operative procedure, stratified at the cohort-wide median. Characteristics of the treating facility encompassed designation (Academic/Research, Community, Comprehensive Community, or Integrated Network Cancer Programs) and institutional caseload, grouped into low (< 96 cases), medium (96–416 cases), or high (> 416 cases) strata using total NEN case counts as the benchmark. Locale type (metro, urban, or rural) and distance traversed for treatment (< 96.7 vs. ≥ 96.7 miles, using the cohort median as the cut-point) were also accounted for.
Outcomes and statistical analysis
The primary endpoint was overall survival (OS), calculated by the Kaplan-Meier (KM) method, with comparisons performed using the log-rank test. A series of multivariable Cox proportional hazards models was constructed to isolate independent correlates of OS. These models were adjusted for age, sex, racial/ethnic identity, SES index, Charlson-Deyo comorbidity score, facility type, and annual caseload, community descriptor, travel mileage, primary tumor site, time elapsed from diagnosis to surgery, surgical margin involvement, lymphovascular invasion, tumor grade, and utilization of CRS or systemic therapy.
A sensitivity check was undertaken by limiting the dataset to G1 and G2 (well- and moderately differentiated) tumors to confirm the stability of the core observations. A dedicated examination limited to G3 tumors was not tenable owing to sparse case numbers. All testing used a two-sided p-value threshold of 0.05 to define statistical significance.
Institutional review board clearance was waived because the NCDB maintains fully anonymized patient data.
Results and Discussion
Baseline clinical and demographic characteristics
Key clinical and demographic attributes at baseline are cataloged in Table 1. Of the 3,183 patients, 2,222 (69.8%) were managed with CRS as the sole treatment, 214 (6.7%) underwent CRS concurrently with systemic chemotherapy, and 747 (23.4%) were treated with systemic chemotherapy without surgery. Individuals assigned to the surgery-only pathway tended to be somewhat older; the 60–69 years age decade accounted for 32.8% of this group, whereas individuals below 50 years were most heavily concentrated in the dual-therapy group (26.2%). Gender proportions were roughly equivalent across groups, although men comprised a slightly larger share of the systemic chemotherapy-alone arm (55.6%).
Table 1. Baseline clinical and demographic characteristics.
|
|
P-value |
Systemic chemotherapy |
CRS and systemic chemotherapy |
Cytoreductive surgery (CRS) |
|
N |
|
747 (23.4%) |
214 (6.7%) |
2,222 (69.8%) |
|
Age (years) |
||||
|
< 50 50–59 60–69 70–79 80–89 |
< 0.001 |
133 (17.8%) |
56 (26.2%) |
380 (17.1%) |
|
242 (32.4%) |
64 (29.9%) |
574 (25.9%) |
||
|
217 (29.1%) |
62 (29.0%) |
727 (32.8%) |
||
|
124 (16.6%) |
30 (14.0%) |
443 (20.0%) |
||
|
30 (4.0%) |
2 (0.9%) |
94 (4.2%) |
||
|
Sex |
||||
|
Male |
< 0.001 |
415 (55.6%) |
104 (48.6%) |
1,055 (47.5%) |
|
Female |
332 (44.4%) |
110 (51.4%) |
1167 (52.5%) |
|
|
Race and ethnicity |
||||
|
Non-Hispanic White |
< 0.001 |
549 (73.5%) |
163 (76.2%) |
1,761 (79.3%) |
|
Non-Hispanic Black |
110 (14.7%) |
21 (9.8%) |
235 (10.6%) |
|
|
Hispanic |
46 (6.2%) |
10 (4.7%) |
129 (5.8%) |
|
|
Non-Hispanic others and unknown |
42 (5.6%) |
20 (9.3%) |
97 (4.4%) |
|
|
SES index |
||||
|
1 (lowest) |
0.021 |
74 (11.7%) |
17 (9.4%) |
135 (7.3%) |
|
2 |
73 (11.6%) |
19 (10.6%) |
183 (9.9%) |
|
|
3 |
70 (11.1%) |
18 (10.0%) |
253 (13.6%) |
|
|
4 |
79 (12.5%) |
30 (16.7%) |
268 (14.4%) |
|
|
5 |
86 (13.7%) |
33 (18.3%) |
299 (16.1%) |
|
|
6 |
120 (19.0%) |
36 (20.0%) |
337 (18.2%) |
|
|
7 (highest) |
128 (20.3%) |
27 (15.0%) |
381 (20.5%) |
|
|
Insurance |
||||
|
Not insured |
< 0.001 |
18 (2.4%) |
7 (3.3%) |
30 (1.4%) |
|
Private insurance/Managed care |
395 (52.9%) |
132 (61.7%) |
1152 (51.8%) |
|
|
Medicaid |
66 (8.8%) |
9 (4.2%) |
120 (5.4%) |
|
|
Medicare |
254 (34.0%) |
59 (27.6%) |
867 (39.0%) |
|
|
Other/Unknown |
14 (1.9%) |
7 (3.3%) |
53 (2.4%) |
|
|
Charlson-deyo score |
||||
|
0 |
0.34 |
573 (76.7%) |
161 (75.2%) |
1,624 (73.1%) |
|
1 |
132 (17.7%) |
38 (17.8%) |
438 (19.7%) |
|
|
≥ 2 |
42 (5.6%) |
15 (7.0%) |
160 (7.2%) |
|
|
Facility type |
||||
|
Academic/Research |
< 0.001 |
341 (48.4%) |
104 (54.2%) |
1237 (58.5%) |
|
Community cancer |
37 (5.3%) |
5 (2.6%) |
50 (2.4%) |
|
|
Comprehensive community cancer |
216 (30.7%) |
53 (27.6%) |
482 (22.8%) |
|
|
Integrated network cancer |
110 (15.6%) |
30 (15.6%) |
346 (16.4%) |
|
|
Facility volume |
||||
|
< 96 |
< 0.001 |
170 (22.8%) |
27 (12.6%) |
267 (12.0%) |
|
96–416 |
324 (43.4%) |
100 (46.7%) |
981 (44.1%) |
|
|
> 416 |
253 (33.9%) |
87 (40.7%) |
974 (43.8%) |
|
|
Distance traveled |
||||
|
< 96.7 miles |
0.025 |
584 (78.2%) |
152 (71.0%) |
1638 (73.7%) |
|
≥ 96.7 miles |
163 (21.8%) |
62 (29.0%) |
584 (26.3%) |
|
|
Community designation |
||||
|
Metro |
0.32 |
611 (86.5%) |
175 (87.1%) |
1774 (85.9%) |
|
Urban |
79 (11.2%) |
21 (10.4%) |
262 (12.7%) |
|
|
Rural |
16 (2.3%) |
5 (2.5%) |
29 (1.4%) |
|
|
Primary site |
||||
|
Pancreas |
< 0.001 |
390 (52.2%) |
83 (38.8%) |
429 (19.3%) |
|
Stomach |
34 (4.6%) |
7 (3.3%) |
34 (1.5%) |
|
|
Small intestine |
232 (31.1%) |
106 (49.5%) |
1631 (73.4%) |
|
|
Appendix |
6 (0.8%) |
4 (1.9%) |
19 (0.9%) |
|
|
Colon |
46 (6.2%) |
11 (5.1%) |
82 (3.7%) |
|
|
Rectum |
39 (5.2%) |
3 (1.4%) |
27 (1.2%) |
|
|
Days from diagnosis to surgery |
||||
|
≤ 35 |
0.33 |
NA |
117 (54.7%) |
1107 (49.8%) |
|
> 35 |
NA |
97 (45.3%) |
1115 (50.2%) |
|
|
Surgical margins |
||||
|
Negative |
0.069 |
NA |
127 (70.9%) |
1,603 (77.4%) |
|
Positive |
NA |
52 (29.1%) |
468 (22.6%) |
|
|
Lymphovascular invasion |
||||
|
Yes |
< 0.001 |
162 (62.0%) |
130 (81.3%) |
1,488 (79.1%) |
|
Grade |
||||
|
G1/Well-differentiated |
< 0.001 |
474 (64.7%) |
137 (64.6%) |
1,502 (67.7%) |
|
G2/Moderately-differentiated |
241 (32.9%) |
68 (32.1%) |
700 (31.5%) |
|
|
G3 |
18 (2.5%) |
7 (3.3%) |
17 (0.8%) |
|
|
Metastatic pattern |
||||
|
Hepatic-only |
0.44 |
511 (77.5%) |
136 (73.1%) |
1477 (76.9%) |
|
Extrahepatic |
148 (22.5%) |
50 (26.9%) |
444 (23.1%) |
|
The racial and ethnic composition diverged meaningfully by treatment assignment: non-Hispanic White subjects accounted for the largest share in each stratum (79.3% in the surgery group, 76.2% in the surgery-plus-chemotherapy group, and 73.5% in the chemotherapy-only group; P < 0.001). SES distributions also differed: individuals in the lowest SES tier (Index 1) accounted for 11.7% of the systemic-only group, compared with 7.3% of the CRS group. Insurance coverage patterns separated the therapeutic pathways (P < 0.001); in all groups, the majority of participants held either private plans or Medicare. Comorbidity profiles remained distributed comparably across the three arms (P = 0.34).
Striking contrasts emerged when hospital type was treated as a factor (P < 0.001): CRS was most heavily concentrated in academic settings. A congruent trend was evident for institutional volume, with surgery occurring preferentially at facilities classified as medium- or high-volume (P < 0.001). Travel burden demonstrated modest variation (P = 0.025); surgical candidates were more likely to commute beyond 96.7 miles (26.3%) than those restricted to systemic treatment (21.8%). The type of community from which patients originated did not differentiate the groups appreciably.
The primary organ site composition shifted substantially by treatment (P < 0.001): tumors of the small intestine were vastly overrepresented among those receiving CRS (73.4%), whereas pancreatic primaries constituted the single largest contingent within the systemic therapy-only arm (52.2%). The median wait from diagnosis to the operating room did not distinguish between the surgical cohorts (P = 0.33). The incidence of microscopically positive margins was broadly analogous across groups (P = 0.069). Lymphovascular invasion was most frequent in the CRS-plus-chemotherapy cluster (81.3%) and least frequent among those managed without surgery (62.0%). Grade distributions also differed (P < 0.001): G1/well-differentiated and G2/moderately differentiated tumors dominated each category, whereas G3 well-differentiated tumors were uncommon (0.8%–3.3%). The anatomical extent of metastases did not differ between groups (P = 0.44); hepatic-confined disease was documented in roughly three-quarters of participants, irrespective of therapeutic assignment.
Survival outcomes by treatment modality and clinical subgroups
Unadjusted analysis revealed a pronounced difference in overall survival by treatment approach (Figure 1). The most favorable median OS was observed among participants treated with CRS only (140.9 months), an intermediate figure among those receiving both CRS and systemic chemotherapy (96.2 months), and the lowest among those managed with systemic chemotherapy alone (51.6 months) (P < 0.001). When the analysis was split by histologic grade, the survival advantage attributable to operative intervention was preserved within the G1–G2 subset (140.9 vs. 96.2 vs. 53.6 months, P < 0.001) and emerged with equal clarity among G3 well-differentiated tumors (39.8 vs. 13.1 vs. 9.6 months, P < 0.001).
|
|
|
Figure 1. Overall Survival by Treatment Modality in Metastatic GEP-NENs. Kaplan-Meier survival curves demonstrating median overall survival (OS) among patients with metastatic gastroenteropancreatic neuroendocrine neoplasms (GEP-NENs) treated with cytoreductive surgery (CRS), CRS plus systemic chemotherapy, or systemic chemotherapy alone. CRS plus chemotherapy was associated with significantly improved OS compared with chemotherapy alone. Abbreviations: GEP-NEN = gastroenteropancreatic neuroendocrine neoplasm; CRS = cytoreductive surgery; OS = overall survival. |
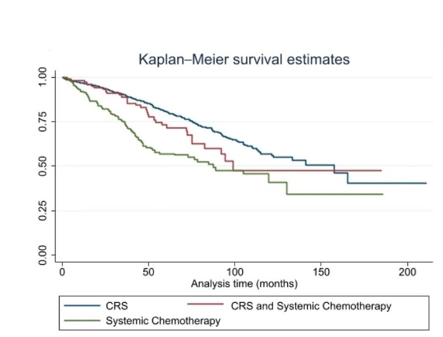
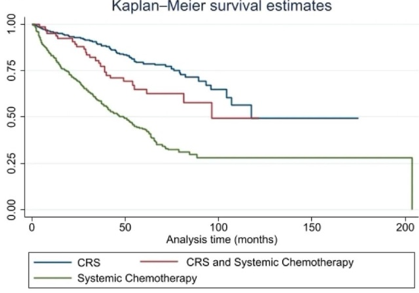
Site-specific dissection mirrored the aggregate results. Among patients harboring midgut small bowel primaries, the incorporation of CRS—whether deployed independently or alongside systemic agents—was correlated with extended survival relative to systemic therapy alone (157.6 vs. 99.2 vs. 87.5 months, P < 0.001) (Figure 2a). Within the pancreatic NEN subgroup, operative cytoreduction analogously translated into a survival benefit (117.5 months vs. not reached vs. 50.8 months, P < 0.001) (Figure 2b).
|
|
|
|
a) |
b) |
|
Figure 2. Kaplan‑Meier survival estimates: (a) Overall Survival by Treatment in Midgut (Small Bowel) NENs. Kaplan-Meier curves showing OS among patients with metastatic small bowel neuroendocrine neoplasms (NENs) treated with CRS, CRS plus systemic chemotherapy, or systemic chemotherapy alone. CRS plus chemotherapy was associated with significantly prolonged OS compared with chemotherapy alone; (b) Overall Survival by Treatment in Pancreatic NENs. Kaplan-Meier curves showing OS among patients with metastatic pancreatic neuroendocrine neoplasms (NENs) treated with CRS, CRS plus systemic chemotherapy, or systemic chemotherapy alone. CRS plus chemotherapy was associated with longer OS than chemotherapy alone. Abbreviations: NEN = neuroendocrine neoplasm; CRS = cytoreductive surgery; OS = overall survival. |
|
Adjusted predictors of survival
Multivariable Cox modeling (Table 2) identified a cluster of variables that independently signaled worse overall survival. Older age exerted a marked dose-response relationship: with patients under the age of 50 serving as the referent, the hazard of death was substantially magnified for those aged 60–69 (HR = 2.64, 95% CI: 1.81-3.85), 70–79 (HR = 3.72, 95% CI: 2.46-5.62), and 80–89 (HR = 9.13, 95% CI: 5.83-14.28) (all P < 0.001). Lower SES independently predicted poorer outcomes, with the lowest SES index position associated with a 49% increase in mortality risk relative to the topmost SES tier (HR = 1.49, 95% CI: 1.06-2.07). A heightened burden of comorbid illness independently worsened prognosis, as reflected by a Charlson-Deyo score of two or greater, conveying a 55% relative surge in the hazard of death (HR = 1.55, 95% CI: 1.19-2.01, P = 0.001).
Table 2. Multivariable Cox regression analysis of factors associated with overall survival.
|
G1/Well-differentiated and G2/Moderately-differentiated |
All tumor grades |
|||
|
P-value |
HR (95% CI) |
P-value |
HR (95% CI) |
|
|
Age (years) |
||||
|
< 50 |
P-value |
Ref |
P-value |
Ref |
|
50–59 |
0.043 |
1.50 (1.01–2.23) |
0.053 |
1.47 (0.99–2.17) |
|
60–69 |
< 0.001 |
2.70 (1.84–3.96) |
< 0.001 |
2.64 (1.81–3.85) |
|
70–79 |
< 0.001 |
3.83 (2.51–5.83) |
< 0.001 |
3.72 (2.46–5.62) |
|
80–89 |
< 0.001 |
9.23 (5.85–14.57) |
< 0.001 |
9.13 (5.83–14.28) |
|
Sex |
||||
|
Male |
P-value |
Ref |
P-value |
Ref |
|
Female |
0.107 |
0.88 (0.75–1.03) |
0.131 |
0.88 (0.75–1.04) |
|
Race and ethnicity |
||||
|
Non-Hispanic White |
P-value |
Ref |
P-value |
Ref |
|
Non-Hispanic Black |
0.142 |
1.21 (0.94–1.58) |
0.200 |
1.18 (0.91–1.53) |
|
Hispanic |
0.828 |
0.96 (0.63–1.44) |
0.811 |
0.95 (0.64–1.42) |
|
Non-Hispanic others and unknown |
0.679 |
0.92 (0.61–1.38) |
0.611 |
0.90 (0.60–1.34) |
|
SES index |
||||
|
7 (highest) |
P-value |
Ref |
P-value |
Ref |
|
6 |
0.633 |
1.07 (0.82–1.40) |
0.648 |
1.06 (0.82–1.39) |
|
5 |
0.171 |
1.21 (0.92–1.59) |
0.191 |
1.20 (0.87–1.52) |
|
4 |
0.439 |
1.12 (0.84–1.49) |
0.340 |
1.15 (0.87–1.52) |
|
3 |
0.809 |
1.04 (0.77–1.39) |
0.759 |
1.05 (0.78–1.40) |
|
2 |
0.059 |
1.34 (0.99–1.82) |
0.053 |
1.35 (1.00–1.83) |
|
1 |
0.034 |
1.44 (1.03–2.01) |
0.019 |
1.49 (1.06–2.07) |
|
Insurance status |
||||
|
Private insurance |
P-value |
Ref |
P-value |
Ref |
|
Not insured |
0.387 |
0.71 (0.33–1.53) |
0.411 |
0.73 (0.34–1.55) |
|
Medicaid |
0.660 |
1.10 (0.73–1.65) |
0.422 |
1.17 (0.79–1.74) |
|
Medicare |
0.263 |
1.13 (0.91–1.41) |
0.204 |
1.15 (0.93–1.43) |
|
Other/Unknown |
0.019 |
1.88 (1.11–3.21) |
0.019 |
1.89 (1.11–3.21) |
|
Charlson-deyo score |
||||
|
0 |
P-value |
Ref |
P-value |
Ref |
|
1 |
0.590 |
1.06 (0.86–1.29) |
0.620 |
1.05 (0.86–1.28) |
|
≥2 |
0.001 |
1.59 (1.22–2.07) |
0.001 |
1.55 (1.19–2.01) |
|
Facility type |
||||
|
Academic/Research |
P-value |
Ref |
P-value |
Ref |
|
Community cancer |
0.222 |
1.30 (0.85–1.99) |
0.223 |
1.30 (0.85–1.98) |
|
Comprehensive community cancer |
0.581 |
1.07 (0.85–1.34) |
0.471 |
1.09 (0.87–1.37) |
|
Integrated network cancer |
0.270 |
1.15 (0.90–1.47) |
0.230 |
1.16 (0.91–1.48) |
|
Facility volume |
||||
|
<96 |
P-value |
Ref |
P-value |
Ref |
|
96–416 |
0.420 |
0.91 (0.72–1.14) |
0.454 |
0.91 (0.73–1.15) |
|
>416 |
0.289 |
0.85 (0.63–1.15) |
0.323 |
0.86 (0.64–1.15) |
|
Community designation |
||||
|
Metro |
P-value |
Ref |
P-value |
Ref |
|
Urban |
0.972 |
1.00 (0.79–1.28) |
0.867 |
0.99 (0.77–1.24) |
|
Rural |
0.553 |
1.18 (0.68–2.03) |
0.576 |
1.17 (0.68–2.01) |
|
Primary site |
||||
|
Pancreas |
P-value |
Ref |
P-value |
Ref |
|
Stomach |
0.905 |
1.04 (0.53–2.03) |
0.831 |
1.07 (0.56–2.03) |
|
Small intestine |
0.120 |
0.82 (0.64–1.05) |
0.138 |
0.83 (0.65–1.06) |
|
Appendix |
0.805 |
1.10 (0.52–2.33) |
0.761 |
1.12 (0.53–2.38) |
|
Colon |
0.099 |
1.36 (0.94–1.96) |
0.045 |
1.44 (1.01–2.05) |
|
Rectum |
0.005 |
1.97 (1.22–3.19) |
0.003 |
2.02 (1.26–3.23) |
|
Days from diagnosis to surgery |
||||
|
≤35 |
P-value |
Ref |
P-value |
Ref |
|
>35 |
0.017 |
0.81 (0.68–0.96) |
0.007 |
0.79 (0.67–0.94) |
|
Surgical margins |
||||
|
Negative |
P-value |
Ref |
P-value |
Ref |
|
Positive |
< 0.001 |
1.51 (1.28–1.80) |
< 0.001 |
1.51 (1.27–1.78) |
|
G1/Well-differentiated |
||||
|
G2/Moderately-differentiated |
P-value |
Ref |
< 0.001 |
1.38 (1.16–1.64) |
|
G3 |
< 0.001 |
1.37 (1.15–1.63) |
< 0.001 |
4.34 (2.44–7.71) |
|
Systemic chemotherapy |
||||
|
No |
P-value |
Ref |
P-value |
Ref |
|
Yes |
< 0.001 |
1.77 (1.39–2.24) |
< 0.001 |
1.71 (1.36–2.17) |
|
Cytoreduction |
||||
|
No |
P-value |
Ref |
P-value |
Ref |
|
Yes |
0.008 |
0.80 (0.67–0.94) |
0.011 |
0.80 (0.68–0.95) |
|
Metastatic pattern |
|
|
|
|
|
Hepatic-only |
P-value |
Ref |
P-value |
Ref |
|
Extrahepatic |
0.910 |
0.99 (0.81–1.20) |
0.943 |
0.99 (0.81–1.21) |
The point of tumor origin exerted an independent influence on outcome: relative to pancreatic primaries, lesions arising in the colon (HR = 1.44, 95% CI: 1.01-2.05) and rectum (HR = 2.02, 95% CI: 1.26-3.23) each independently forecast higher mortality. A longer span from diagnosis to surgical extirpation, specifically exceeding 35 days, independently tracked with a reduced mortality hazard (HR = 0.79, 95% CI: 0.67-0.94, P = 0.007). The finding of involved surgical margins was independently associated with shorter survival (HR = 1.51, 95% CI: 1.27-1.78, P < 0.001). Tumor grade exhibited an independent stepwise association with the risk of death: G2/moderately differentiated histology (HR = 1.38, 95% CI: 1.16-1.64) and G3 well-differentiated histology (HR = 4.34, 95% CI: 2.44-7.71) each predicted inferior OS when set alongside G1 tumors (both P < 0.001).
The administration of systemic chemotherapy was an independent predictor of increased mortality (HR = 1.71, 95% CI: 1.36-2.17, P < 0.001). In contrast, the deployment of cytoreductive surgery remained independently associated with prolonged survival, conferring a 20% reduction in the instantaneous hazard of death (HR = 0.80, 95% CI: 0.68-0.95, P = 0.011). Neither the anatomical extent of metastases (liver-confined vs. extrahepatic) nor the type or volume of the treating institution registered as an independent predictor of OS. In the sensitivity analysis limited to G1/G2 tumors, effect estimates retained directional consistency: advancing age, mounting comorbidity, positive resection margins, higher tumor grade, the use of systemic chemotherapy, and the absence of CRS all remained statistically significant determinants.
How best to manage metastatic GEP-NENs remains unsettled within the clinical community, a direct consequence of the lack of randomized, prospective data. Earlier contributions to the literature—overwhelmingly retrospective in design and derived from isolated centers—linked surgical debulking of hepatic lesions to both palliation and added years of life [9-15]. Those analyses, however, amalgamated patients with widely varying characteristics, featured divergent operative philosophies, imposed no uniform threshold for adequate cytoreduction, and were distorted by patient selection. The most conspicuous omission is that a head-to-head comparison of surgical cytoreduction against systemic therapy was never performed, leaving any estimate of their relative worth speculative. Our project directly addressed this evidence gap by comparing survival trajectories for CRS alone, systemic therapy alone, and their combination, using a large national sample. We believe the work presented here stands as the broadest NCDB-derived examination to date that weighs these three approaches against one another in metastatic GEP-NENs.
Our data showed a pronounced survival benefit with surgical cytoreduction, whether used alone or layered onto systemic chemotherapy, compared with pharmacotherapy alone. The signal appeared uniformly across all grades, though the magnitude of benefit clearly separated G1–G2 tumors—which realized robustly superior OS—from G3 well-differentiated lesions. This gradient aligns with a well-established body of evidence that positions histologic grade as a cardinal predictor of outcome in metastatic GEP-NENs [18]. Reports by Bertani et al. [19] and Scott and Howe [15] traced a parallel pattern, in which patients with lower-grade tumors who underwent aggressive cytoreductive efforts had better survival.
Of note, the survival advantage associated with cytoreduction in our analysis did not depend on the organ of origin; both pancreatic primaries and midgut primaries experienced extended median OS following operative intervention. The results converge with those of Sarmiento et al. [9], who reported that neither 5-year survival fractions nor median OS distinguished small bowel from pancreatic NEN cases after surgical cytoreduction. Building on that work, Maxwell et al. [14] and Scott and Howe [15] later confirmed that the gains in progression-free and overall survival realized with extensive tumor debulking transcended the specific primary anatomical location.
Our data also indicated differences in outcomes by setting of care, with patients treated at academic institutions performing better than those managed in community hospitals. Drawing a causal arrow from this association would be unwarranted. Yet, plausible contributory factors exist: the concentration of surgeons who routinely undertake highly complex, greater-risk operations within academic systems, and the embedded multidisciplinary infrastructure through which NEN care is orchestrated in such environments.
Notwithstanding the multivariable adjustments we applied for pertinent clinical factors, several significant constraints mandate interpretive caution. The study’s retrospective design inherently permits selection biases to operate, and the NCDB provides no fine-grained detail on specific chemotherapy backbones, liver-directed surgical techniques, or ancillary systemic agents. The NCDB only integrates the most current histologic classification schema for individuals diagnosed in 2018 or later. Consequently, we relied on ICD-O-3 codes for those diagnosed before that year and forged a composite grade variable to sustain coherence across the entire time window. It is worth emphasizing that, in our usage, “G3 tumors” refers exclusively to well-differentiated G3 NETs, as poorly differentiated neuroendocrine carcinomas (NECs) were already excluded from the dataset using ICD-O-3 histology filters. The database’s inability to reliably disentangle G3 NET from G3 NEC before 2018 leaves room for some degree of contamination across categories. An additional blind spot involves peptide receptor radionuclide therapy (PRRT). However, regulatory approval arrived in 2018, clinical uptake was not widespread until after 2020, and the NCDB contains no field to capture its use. Investigations that harness richer treatment- and technique-level data drawn from later-era cohorts will be considerably better positioned to dissect the contributions of PRRT and contemporary systemic options to patient outcomes.
Conclusion
The present work reinforces the role of surgically clearing hepatic tumor burden as part of the therapeutic armamentarium for metastatic GEP-NENs. A survival edge favoring surgical cytoreduction over sole reliance on systemic therapy was evident and held irrespective of whether the primary arose in the pancreas or the midgut, and across the spectrum of histologic grade. Until prospective randomized trials materialize, a careful weighing of the potential benefits and operative hazards of cytoreductive surgery should take place in shared decision-making with GEP-NEN patients who exhibit liver involvement and are medically fit for an operation. The data further suggest that channeling these patients to academic centers with deep subspecialty expertise in NEN may yield better outcomes, given the technical demands these procedures place on the care team. Ultimately, these observations must be submitted to the crucible of prospective validation in subsequent studies.
Acknowledgments: Part of the data presented in this study was presented at the 2023 NANETs Annual Meeting. The data used in the study are derived from a de-identified National Cancer Database (NCDB) file. The NCDB is a joint project of the Commission on Cancer of the American College of Surgeons and the American Cancer Society.
Conflict of Interest: None
Financial Support: None
Ethics Statement: None